EIA WPSR Summary for week ending 8-30-24
It’s Possible We Are in a Completely Fraudulent System
EIA WPSR Summary for week ending 8-30-24
Summary
Crude: -6.9 MMB
SPR: +1.8 MMB
Cushing: -1.1 MMB
Gasoline: +0.8 MMB
Distillate: -0.4 MMB
Jet: -0.8 MMB
Ethanol: -0.2 MMB
Propane: +2.6 MMB
Other Oil: -2.5 MMB
Total: -8.0 MMB
Spot WTI is currently pricing $69. Price has diverged completely from estimated fair value based on a price model derived from reported EIA inventories. A divergence of this magnitude has only been witnessed when WTI expired negative during COVID and the initial Russian invasion of Ukraine.
Crude
US Crude oil supply drew by 6.9 MMB. Crude inventories are currently 5% below the seasonal average. This is a large draw but not substantially different than other years. Crude inventories match 2022 and 2023 seasonal levels.
1.8 MMB were added to the SPR.
SPR volumes have increased over 2024. Levels are identical to those during December 1983.
US crude imports fell ~700kbd.
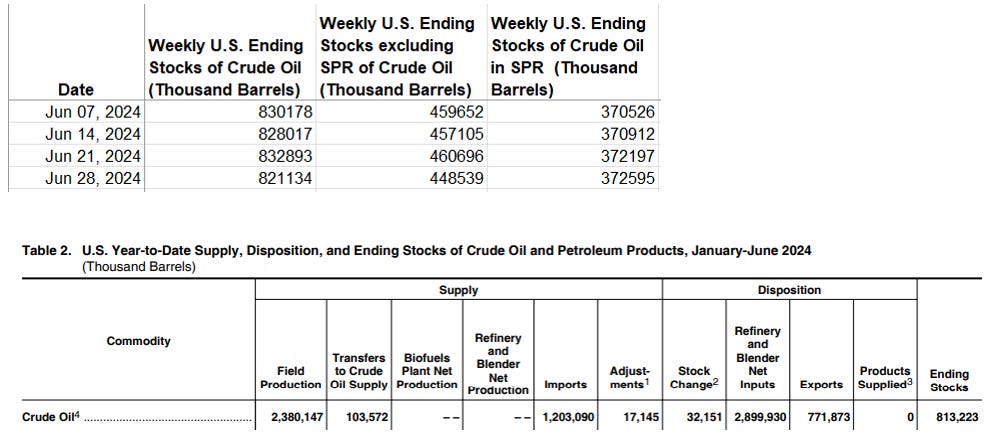
Petroleum Supply monthly shows June imports were lower than that reported in the weeklies.
Weekly US crude exports also fell.
Petroleum Supply monthly shows June exports higher than that reported in the weeklies.
US Customs does have challenges tracking imports and exports in real-time. However, the weekly figures are never updated. This is exceedingly frustrating for those tracking volumes.
It appears the EIA lost ~7 MMB of crude in their accounting by the end of June. That figure is presumably larger now.
Unaccounted for crude is again positive.
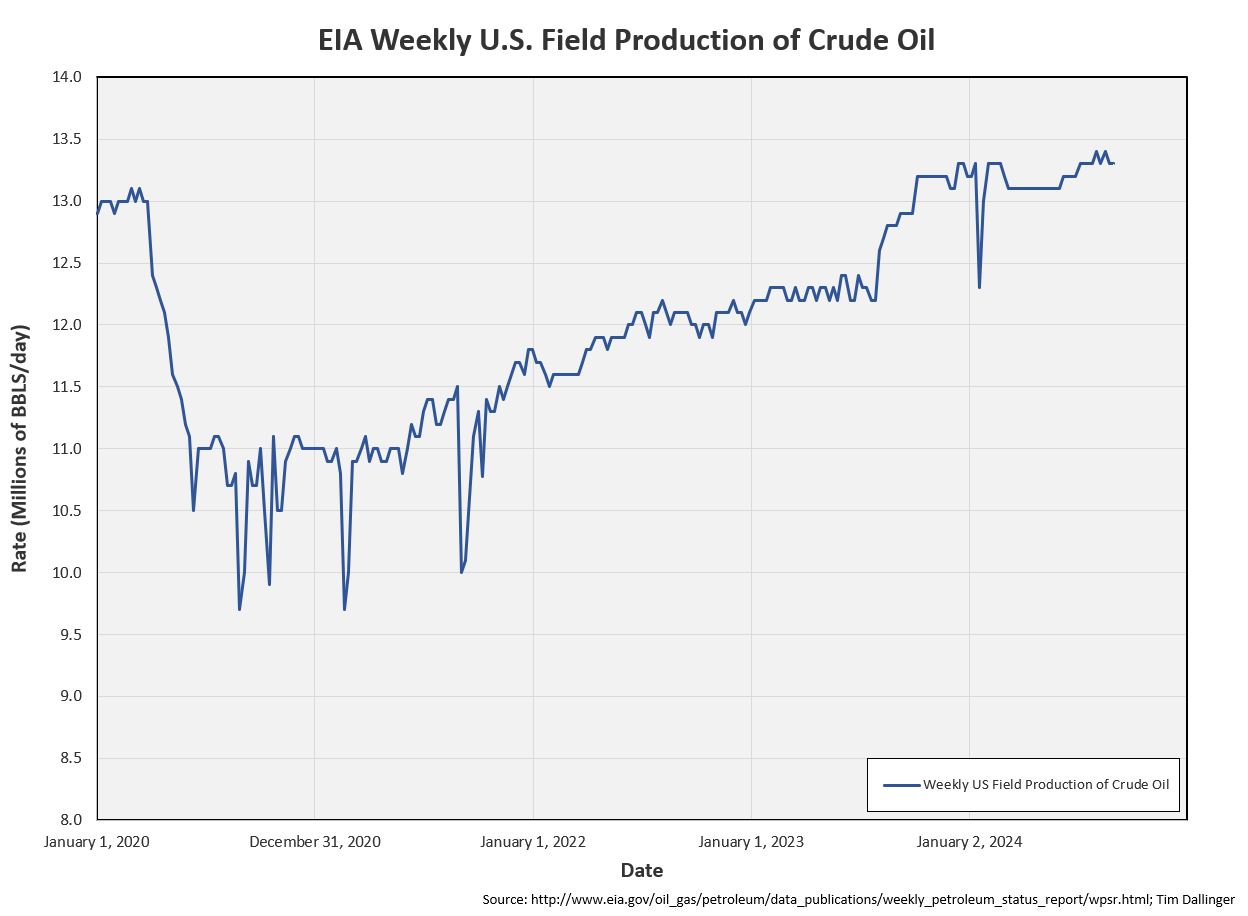
This “extra supply” is not from production though. The weeklies and monthlies are tracking consistently for production.
Transfers to crude supply is increasing though. That is, more natural gas liquids are being mixed into the crude stream.
Cushing
Crude storage in Cushing, OK, drew by 1.1 MMB week on week. Tank bottoms are approaching.
Gasoline
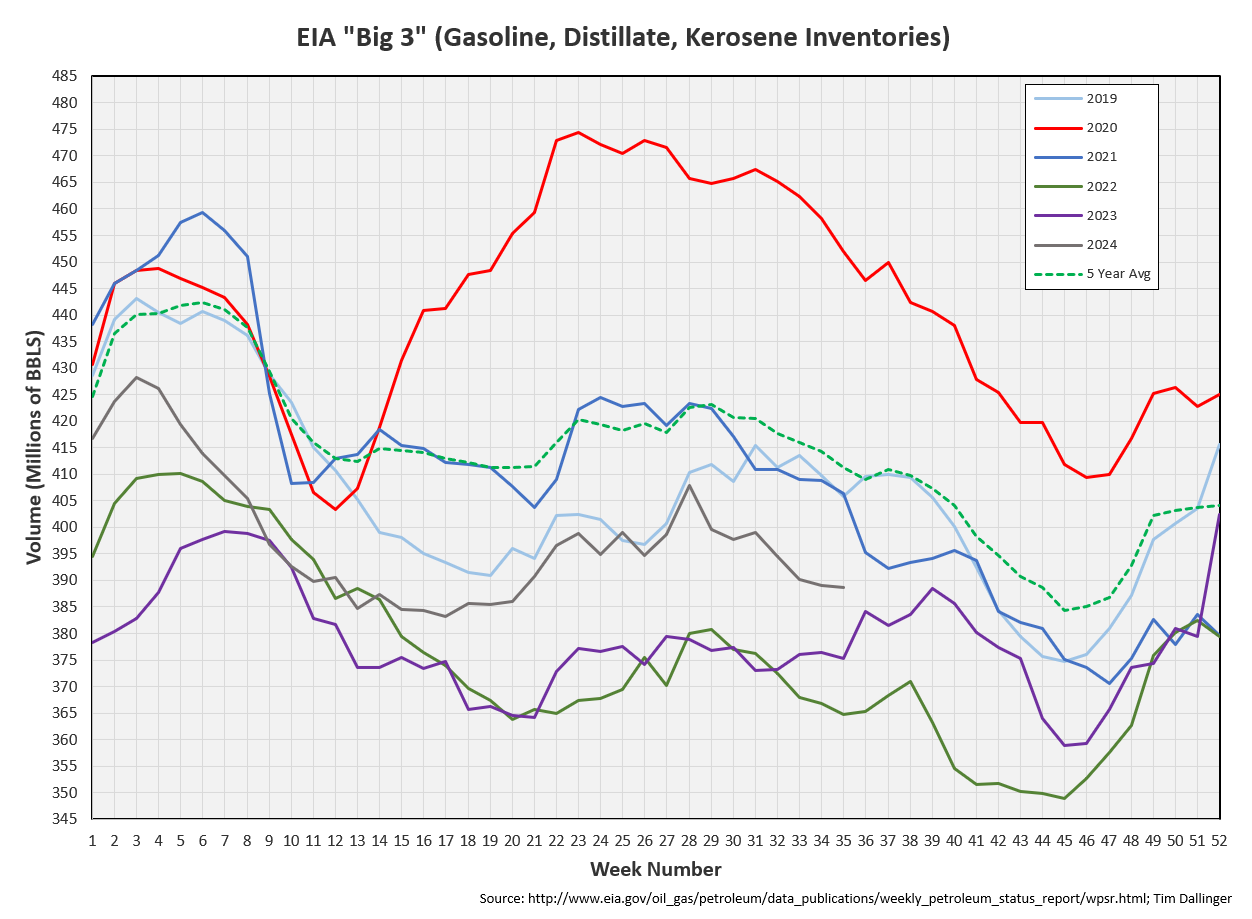
Total motor gasoline inventories increased by 0.8 MMB and are about 2% below the seasonal 5-year average.
Distillate
Distillate fuel inventories decreased by 0.4 MMB last week and are about 10% below the seasonal 5-year average.
Jet
Kerosene type jet fuels drew by 0.8 MMB.
Global flights have fallen back from their summer peak. But they still remain at seasonally record levels.
https://www.airportia.com/flights-monitor/
Ethanol
Ethanol inventories decreased by 0.2 MMB week-on-week. Inventories are above seasonal averages.
Propane
Propane/propylene inventories increased 2.6 MMB. There should be about another 4 to 5 weeks of expected seasonal builds for this category.
Other Oil
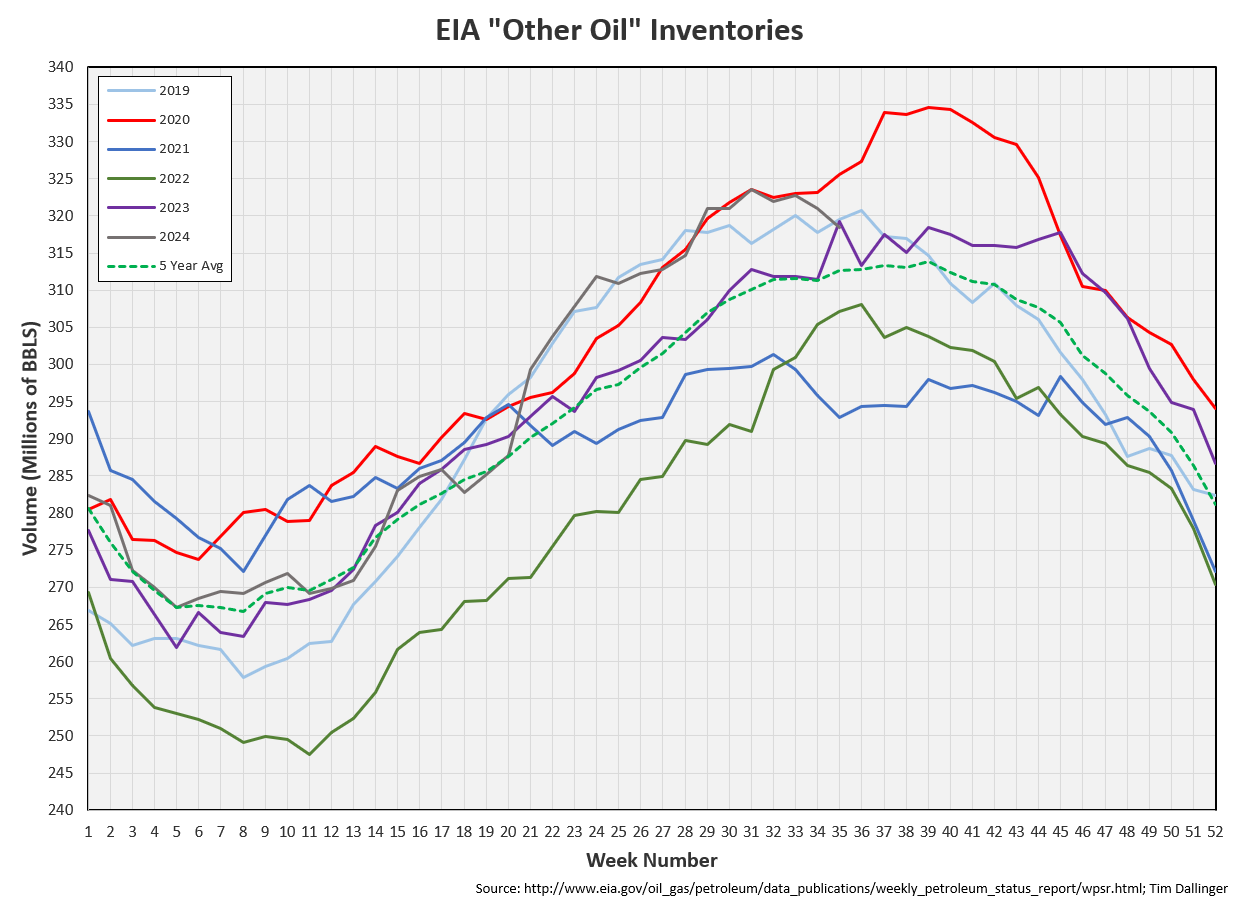
Other oil drew by 2.5 MMB. This is strange behavior. Other oil typically draws seasonally but the pattern has started earlier than expected. Similar behavior occurred in 2019 so there is some precedence. But other oil draws this early are exceedingly rare.
Total Commercial Inventory
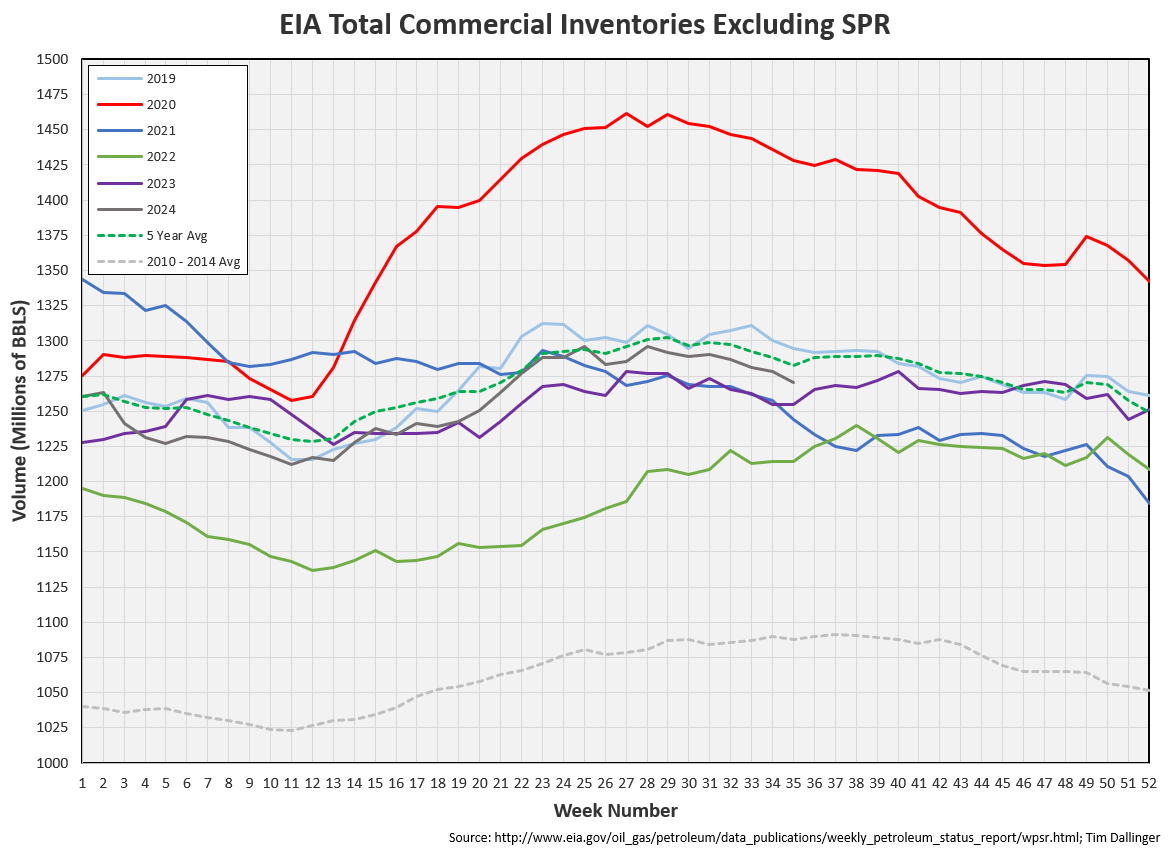
Total commercial inventory drew by 8 MMB. Inventories are below average.
Natural Gas
The trend in natural gas inventory builds has eased. Waha natural gas prices continue to trade in the negative range. Associated natural gas is essentially a waste byproduct in West Texas.
Refiners
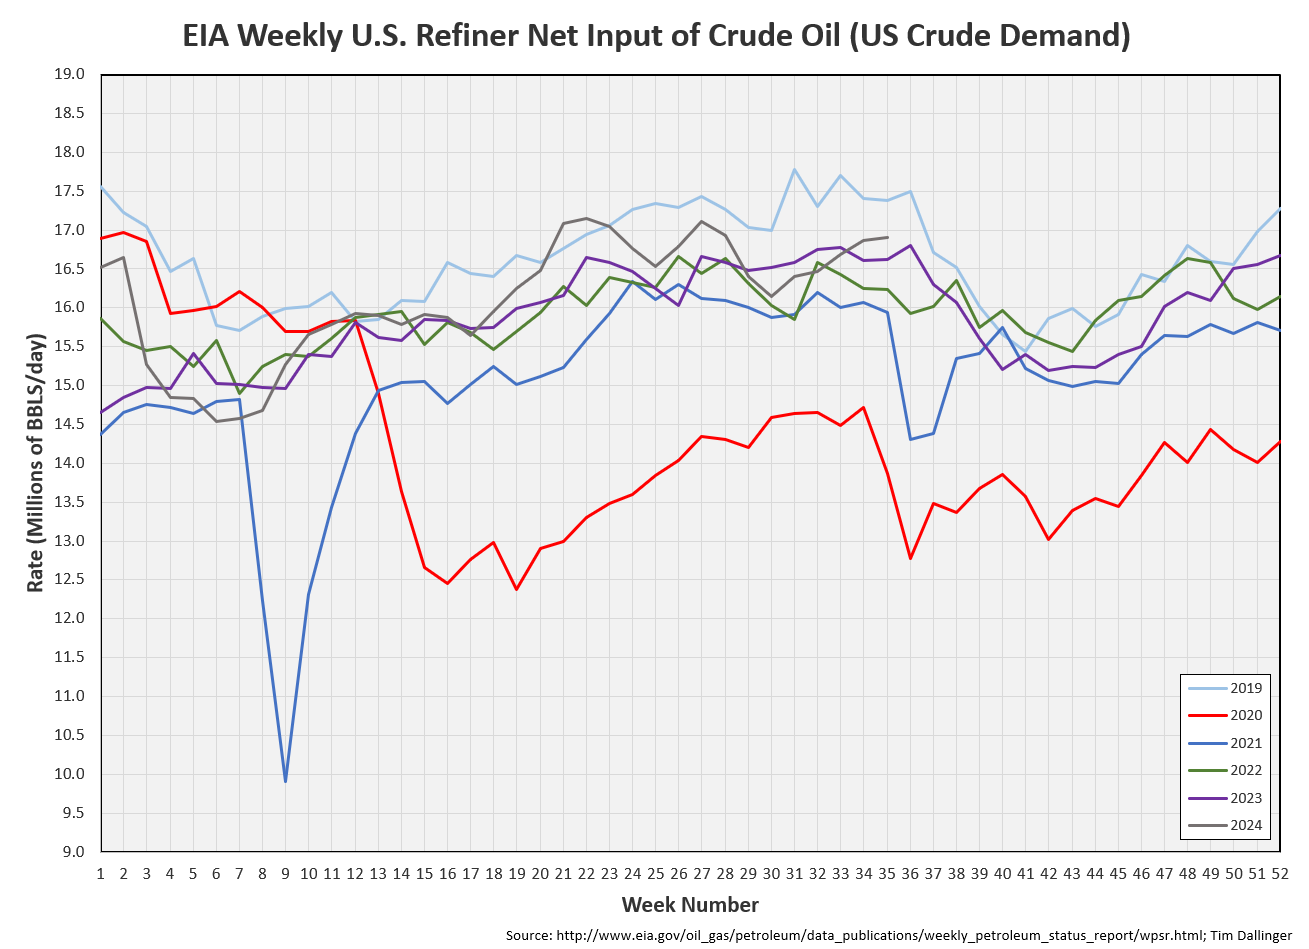
Refiners processed near record levels of crude oil last week. Only 2019 has been higher.
The EIA’s product demand proxy is still low but now recovering.
Transportation inventories continue to decline even with that much crude oil refined and processed.
Crude oil is included in the following graph.
Simple cracks continue to get hammered. One would expect run cuts here and yet refiners are operating near record level output.
Discussion
Crude oil prices continue to fall. Bears point to tepid global economic outlook, poor demand and OPEC oversupply. Yet, data does not support any of these positions.
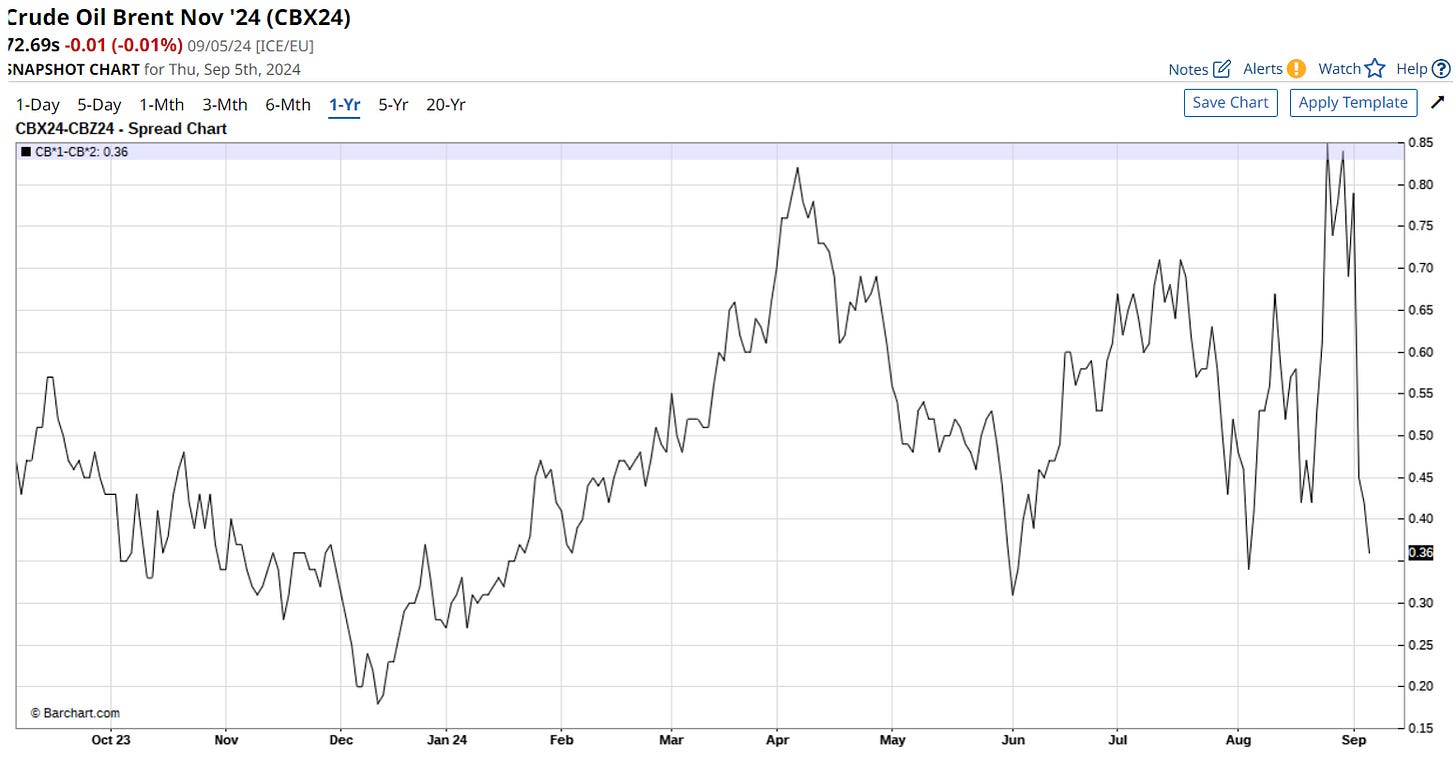
Both WTI and Brent remain backwarded, suggesting that there is no glut. In fact, physical inventories, including oil-on-water continue to draw. Purchase prices for physical deliveries are higher than spot prices.
Some of Libyan oil production remains offline. The amount of lost production is difficult to determine because different figures are being reported daily.
OPEC had planned to ease cuts in Q4. Today, sources report that the planned October output increase has been delayed for 2 months.
With energy being perhaps the most critical component of global economic activities, it’s easy to see how volatile oil markets could spawn rumors and speculation. If one suggests that the Federal Reserve or the US Treasury is participating in the Futures market, they would be quickly dismissed as a conspiracy theorist. Yet, the paper market and the physical market are behaving in an exceedingly odd manner. While there is no direct evidence of manipulation, price is not following the underlying data.
However unlikely it seems, there is some non-zero chance that forces are aligned to keep energy prices contained. It is not difficult to understand what might drive such motivation. Fraud absolutely does occur in markets and sometimes at global macro scales as demonstrated by the 2008 Global Financial Crisis.
Not investment advice. Informational purposes only. No specific positioning or security recommendations are intended. Sources are cited when available but accuracy of 3rd party data cannot be guaranteed.
Fund manager, Dr. Michael Bury, portrayed by Christian Bale in the US dramatic film, “The Big Short,” struggles with the underlying fraudulent conditions that lead to the Global Financial Crisis in 2008.










You might be surprised by the number of experienced market professionals that are saying similar things. If I had proof, I'd be shouting. There's just a whole lot of strange coincidences. Maybe just that. Maybe not.
Was chatting with someone else today - an Anti-Plunge-Protection Team does feel like it could be at work, with elections so near