


EIA WPSR Summary for week ending 3-8-24
Bulls on Parade

EIA WPSR Summary for week ending 3-8-24
Summary
Bullish report, but not as constructive as yesterday’s API. The near-term outlooks appears extremely positive.
Crude: -1.5 MMB
SPR: +0.6 MMB
Cushing: -0.2 MMB
Gasoline: -5.7 MMB
Ethanol: -0.3 MMB
Distillate: +0.9 MMB
Jet: +0.5 MMB
Propane: +0.7 MMB
Other Oil: +1.3 MMB
Total: -4.7 MMB
It appears some export barrels weren’t counted. This should explain the discrepancy between the API and the EIA crude figures this week.
Spot WTI is currently pricing $79. This is fair value based on a price model derived from reported EIA inventories.
Crude
US Crude oil supply drew by 1.5 MMB. Crude inventories are currently 3% below the seasonal average. Crude supplies should have peaked for the year.

0.6 MMB were added to the SPR. 6.5 MMB have been added to the SPR in 2024.

SPR inventories are still low relative historic storage levels. But they have built off the 2023 lows.

US crude imports fell substantially. This is anomalous week. Expect US crude imports to hover around 6.5 MMB.

As mentioned last week, the import spike from Saudi Arabia and Columbia were not sustainable.

Crude exports fell to a 2024 low. This is partially a timing issue. Independent ship trackers showed exports were a bit higher than reported. This should bounce back.

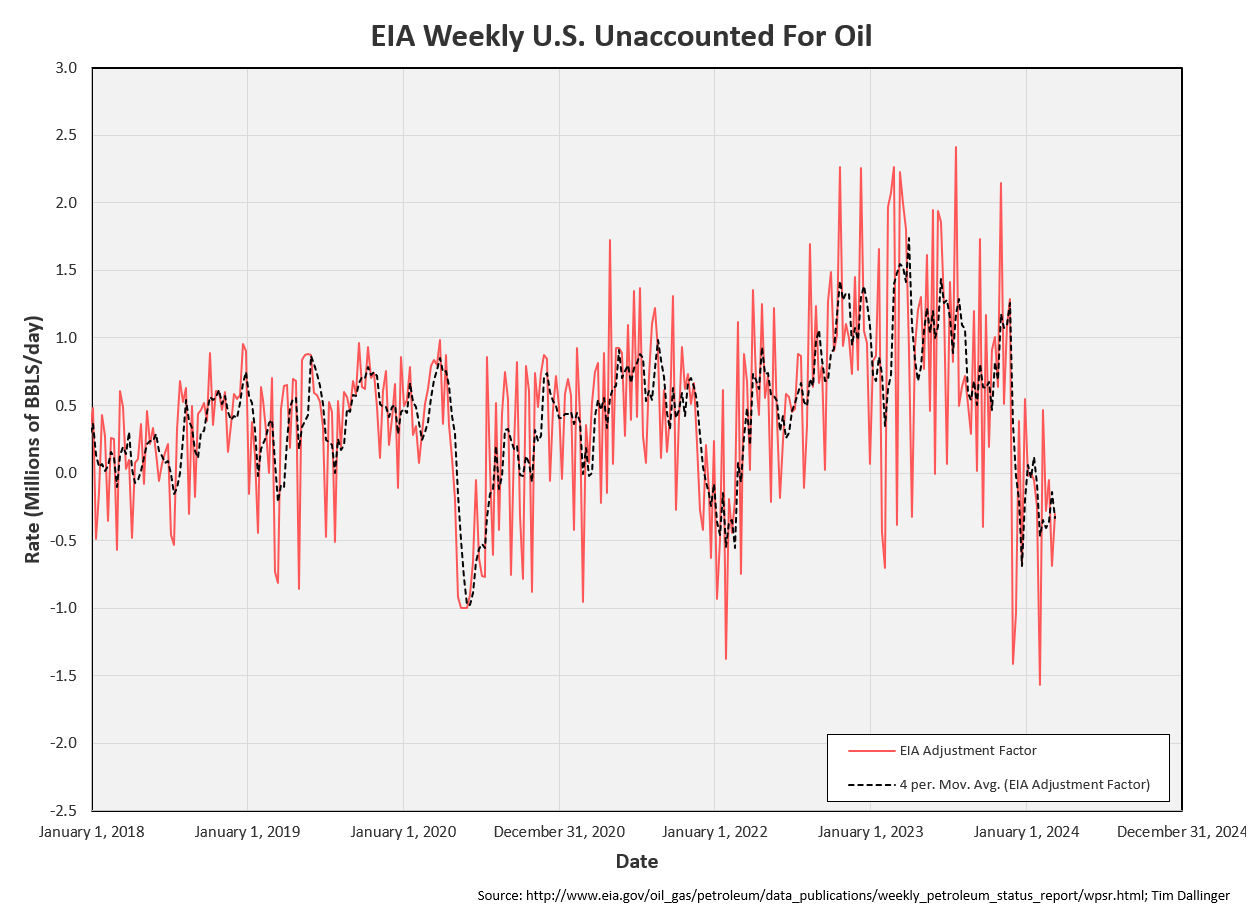
The unaccounted for oil average is negative for 2024. As crude blending is now being considered, this suggests US production is currently overstated.
Cushing
Crude inventories in Cushing, OK fell 0.2 MMB. It’s early for Cushing to experience its summer seasonal downward trajectory.

Canada’s Transmountain is calling for linefill in April and May. The startup date is still planned for late Q2, 2024. It will be interesting to see how this affects Cushing. Currently, Canadian crude can reach Cushing primarily from TC Energy’s Keystone, Enbridge’s mainline via the Flanagan connector. Some of this volume will likely go to the west coast on Transmountain instead.

Credit: RBN Energy
Gasoline
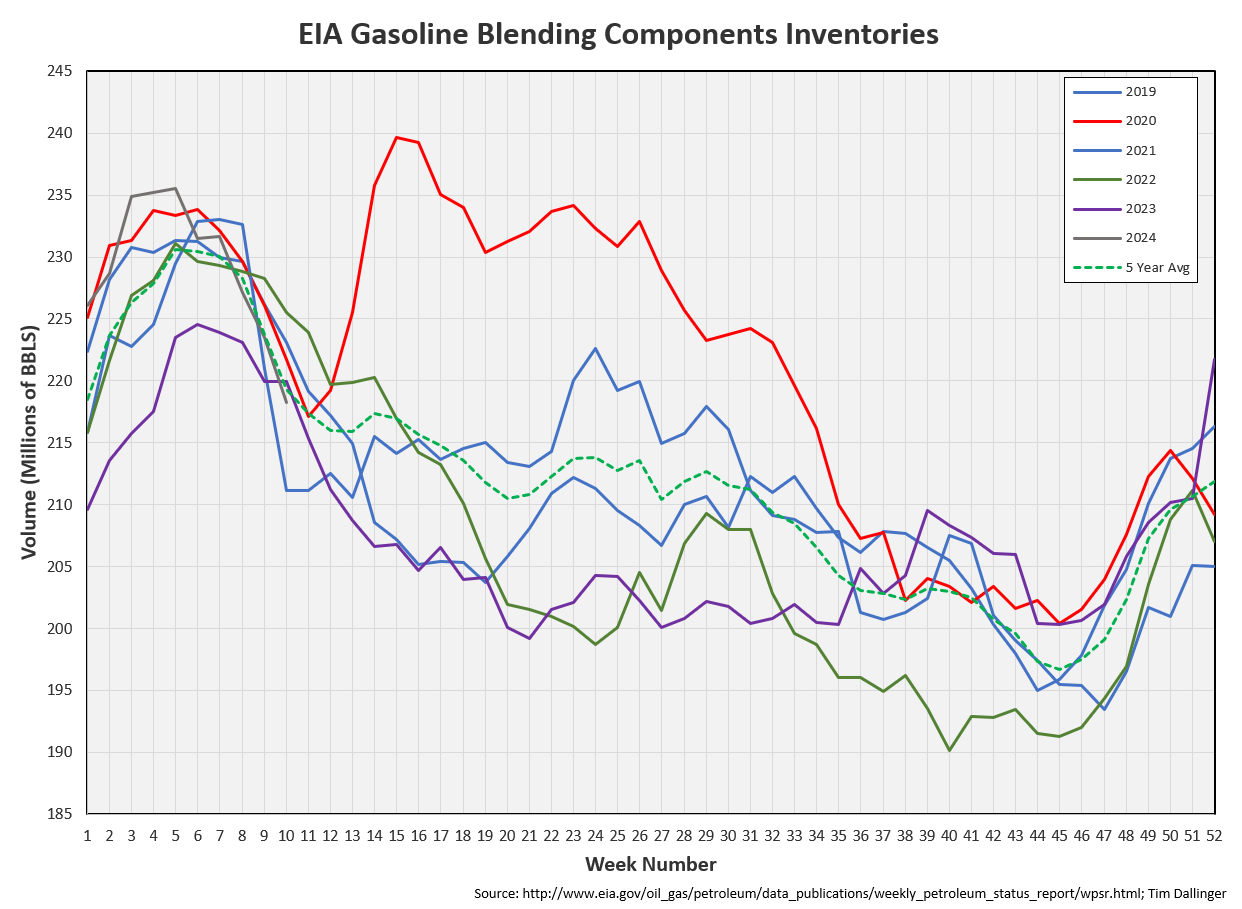
Total motor gasoline inventories decreased by 5.7 MMB and are 3% below the seasonal 5-year average. Gasoline demand is strong headed into spring break and summer blend switching.
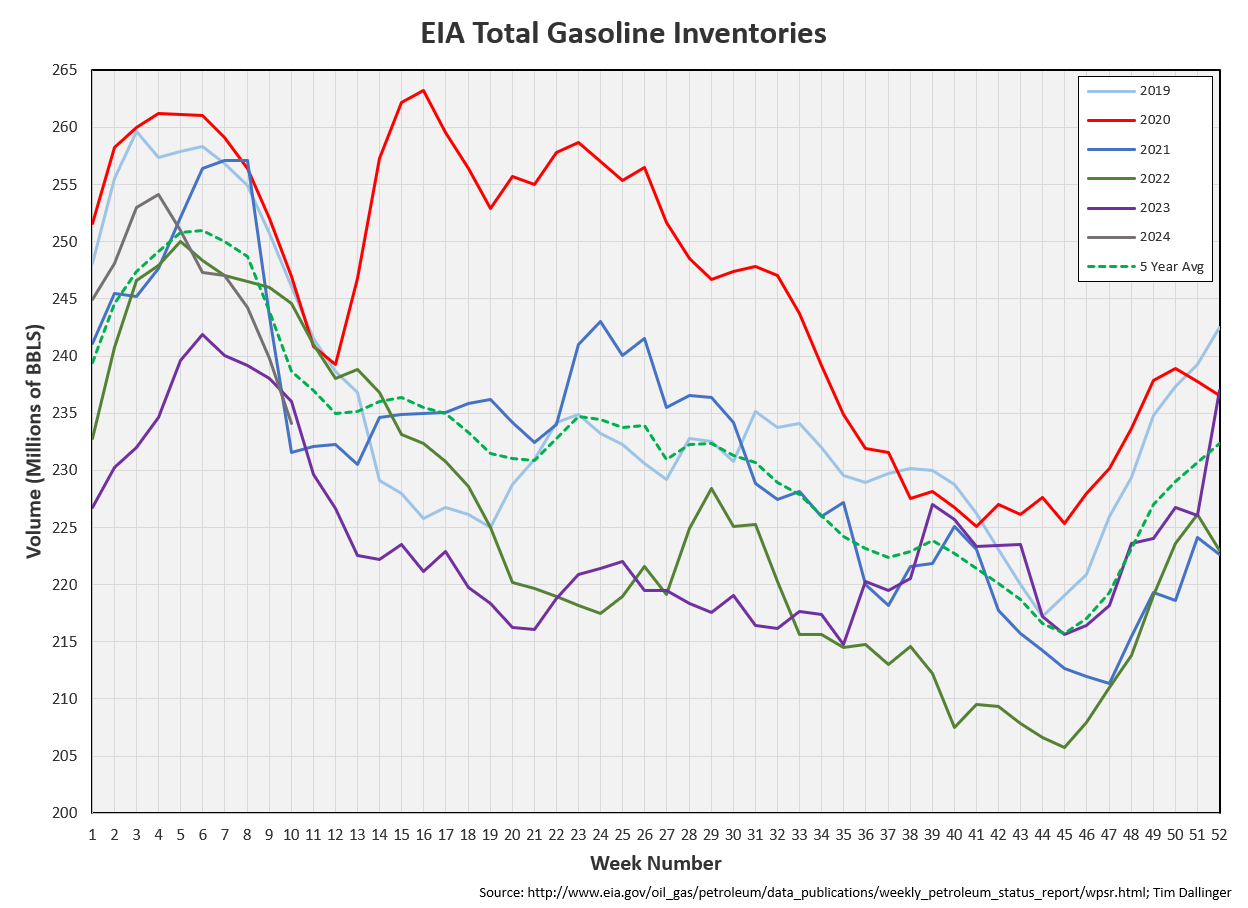
Both finished gasoline and blending components are drawing.
Ethanol
Ethanol inventories drew 0.3 MMB week-on-week. Inventories are still above average.

Distillate
Distillate fuel inventories increased by 0.9 MMB last week and are about 7% below the seasonal 5-year average. This is unexpected, especially considering yesterday’s API showed a significant distillate draw. Draws should return next week.

Jet
Kerosene type jet fuels increased by 0.5 MMB. Seasonal jet inventories are above the 5-year average.

US air travel is at seasonal record levels.

Propane
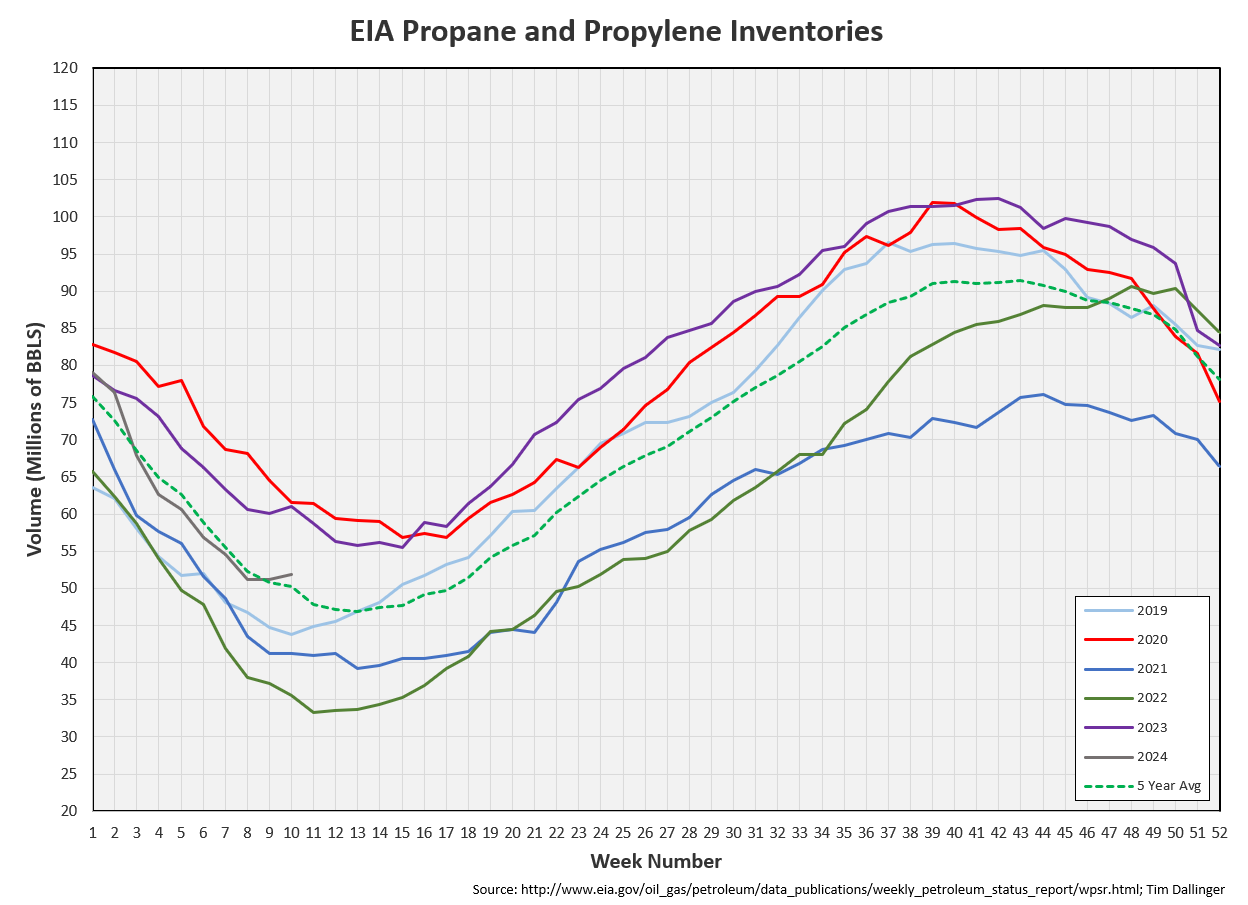
Propane/propylene inventories built 0.7 MMB week-on-week. Inventories are above seasonal averages. Builds don’t normally start for another month. This could be an anomalous week or a signal that there are NGL’s in US production than currently reported.
Other Oil
Other oil increased by 1.3 MMB. Other oil inventories are just above seasonal average.

Total Commercial Inventory
Total commercial inventories drew by 4.7 MMB. Product demand will determine path forward.

Natural Gas
Natural gas inventories drew slightly. Inventories remain high, pressuring price.
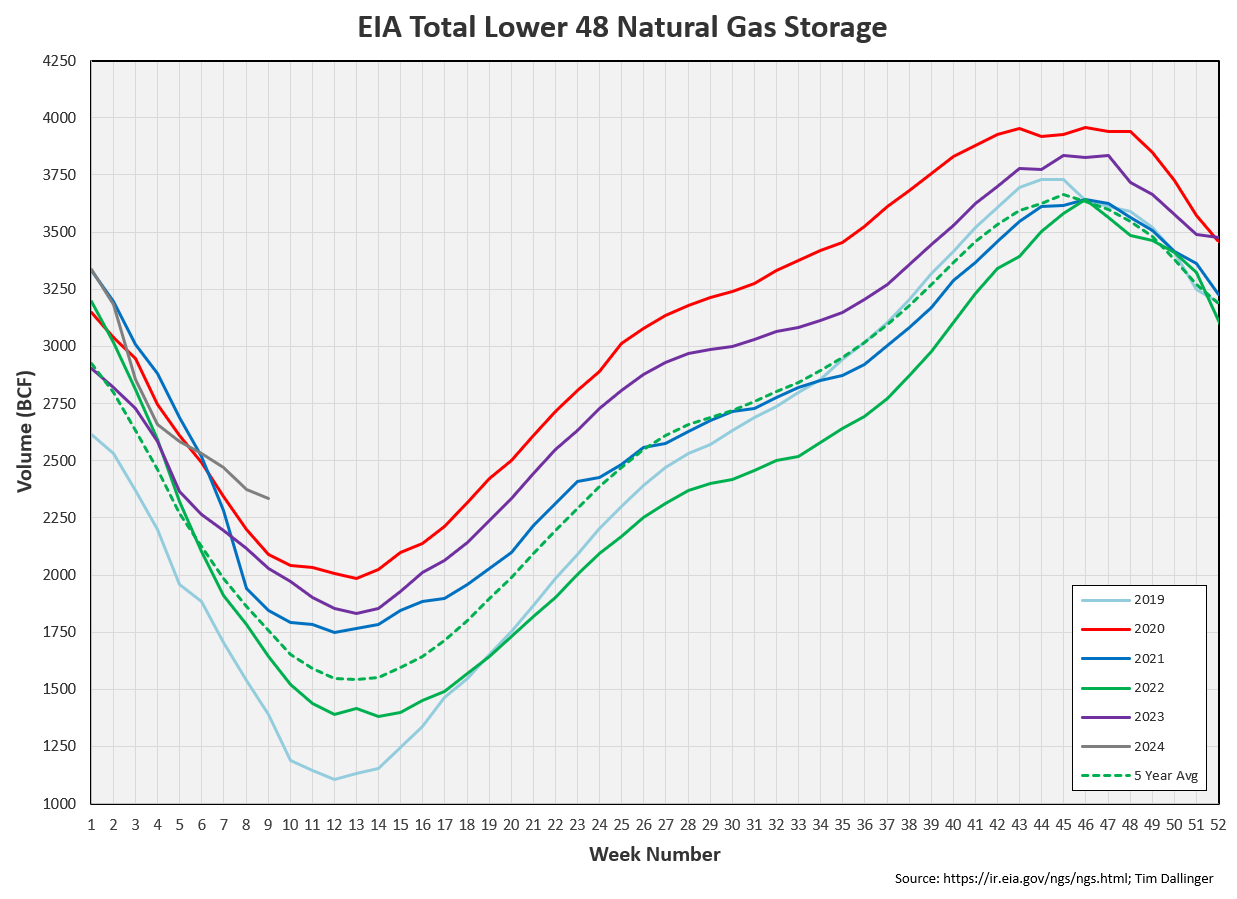
The US mid-continent is expecting snowfall in the next several days. This will likely be the last snap of cold weather. Natural gas will get no additional heating demand boost.
Discussion
US refiners increased utilization this week as they exit maintenance season. Unconfirmed reports still show BP’s Whiting facility has 2 more weeks until it’s back to full capacity. This bodes extremely well for crude oil demand.

The EIA product demand proxy showed a weekly increase. Product inventories and prompt pricing are a better indirect indication of demand.

Transportation inventories are at seasonal low’s.

Cracks continue to improve.

Crude timespreads also continue to show strength, indicating physical markets are healthy.

Even the EIA, in the latest STEO, is now predicting higher oil prices, due to unexpected inventory draws in Q1.

The summer setup is extremely bullish. Even energy equities appear to be participating in this rally.

Credit: Sam Valadi
Not investment advice. Informational purposes only. No specific positioning or security recommendations are intended. Sources are cited when available but accuracy of 3rd party data cannot be guaranteed.
“Bulls on Parade,” is the top single from American rock group Rage Against the Machine’s 1996 album, Evil Empire.
> “Crude supplies should have peaked for the year.”
In your graphs where you make this comment, I don’t see how you come to that conclusion, with most later months on each year timeline trending higher later. What am I missing?