
Tank Bottoms
*It* adds up at the bottom

What Crisis?
The most significant energy supply interruption in history continues and the market continues largely ignore this issue. Critics begrudgingly admit that consumers are paying more for gasoline at the pump. They claim that since crude has come down from the initial spike, this wasn’t a real crisis and those suggesting otherwise are alarmists, grifters, or “pannicans.”
This is a fundamental misunderstanding of energy markets.
Days of Cover
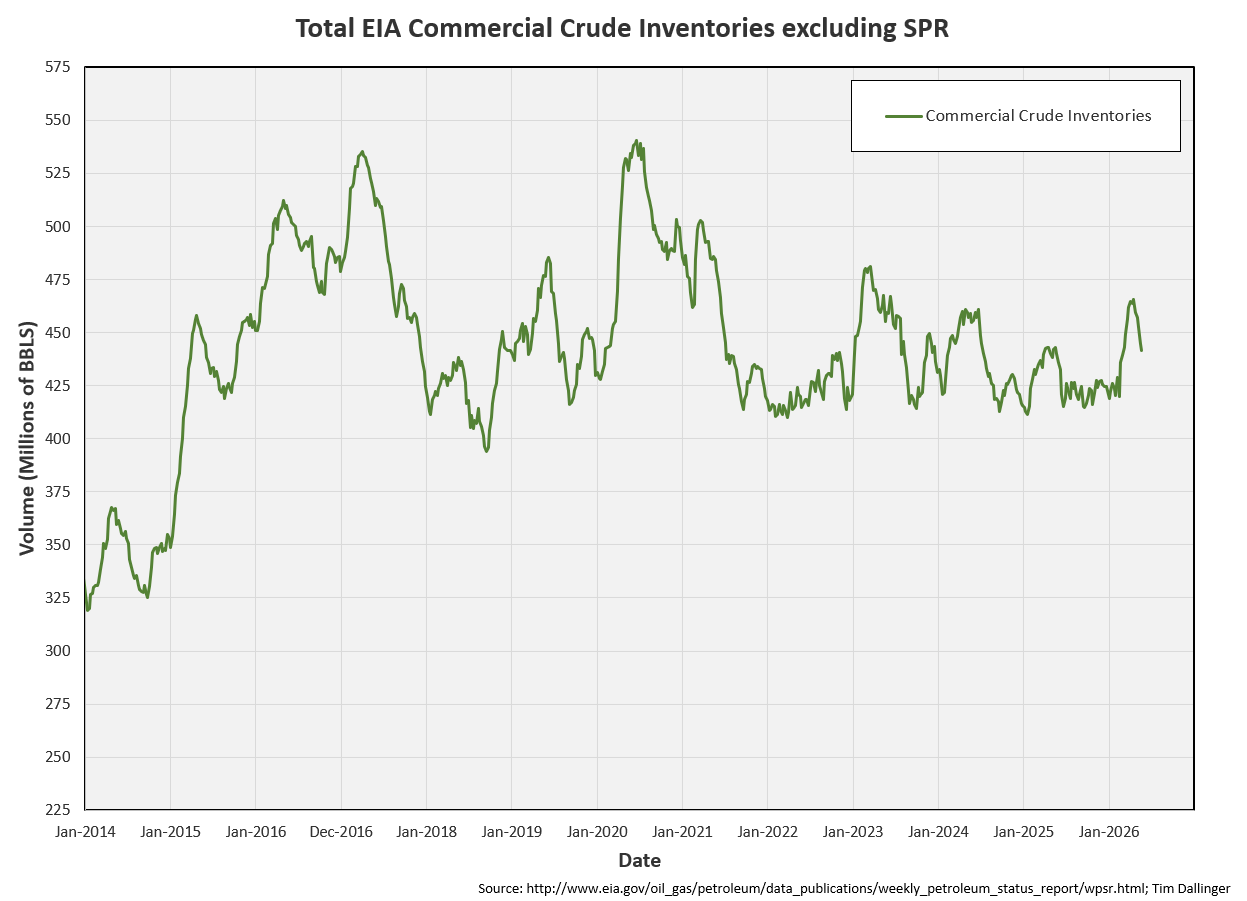
The EIA Weekly Petroleum Supply Report including data current to 5-22-26, showed that the United States crude inventories levels are at 441.7 MMB.
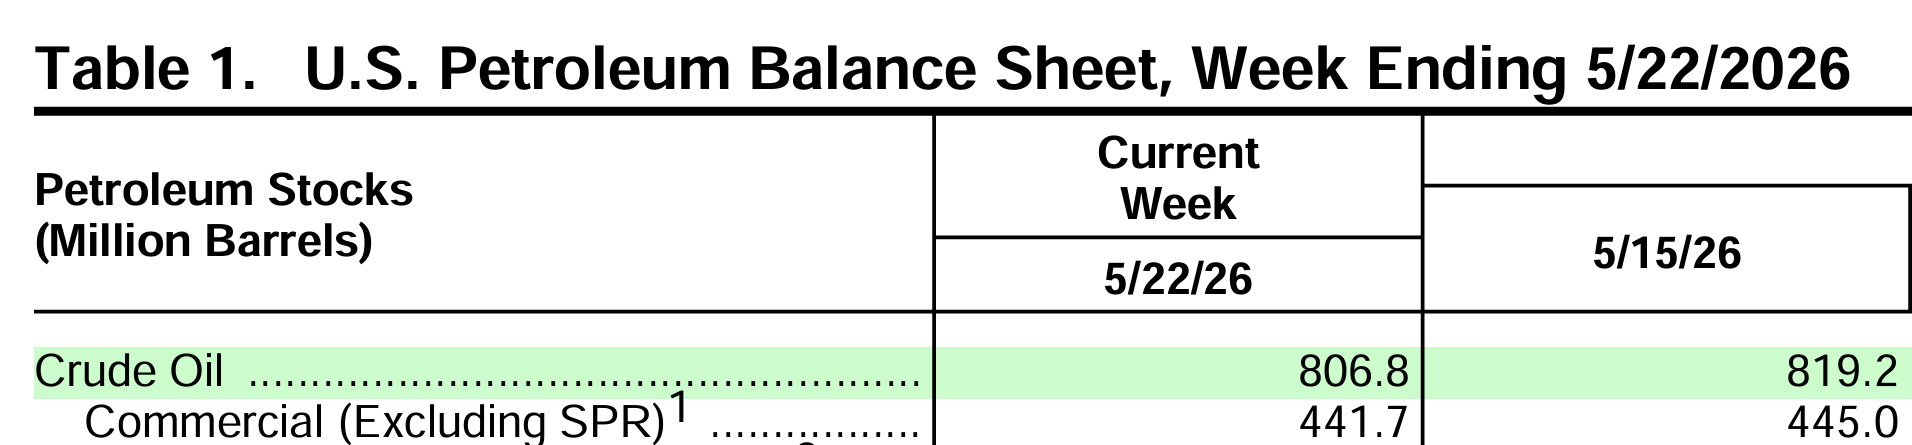
Source: EIA Weekly Petroleum Status Report for week ending May 22, 202 Data Overview
The US refines about 17 MMBD at peak refinery runs.
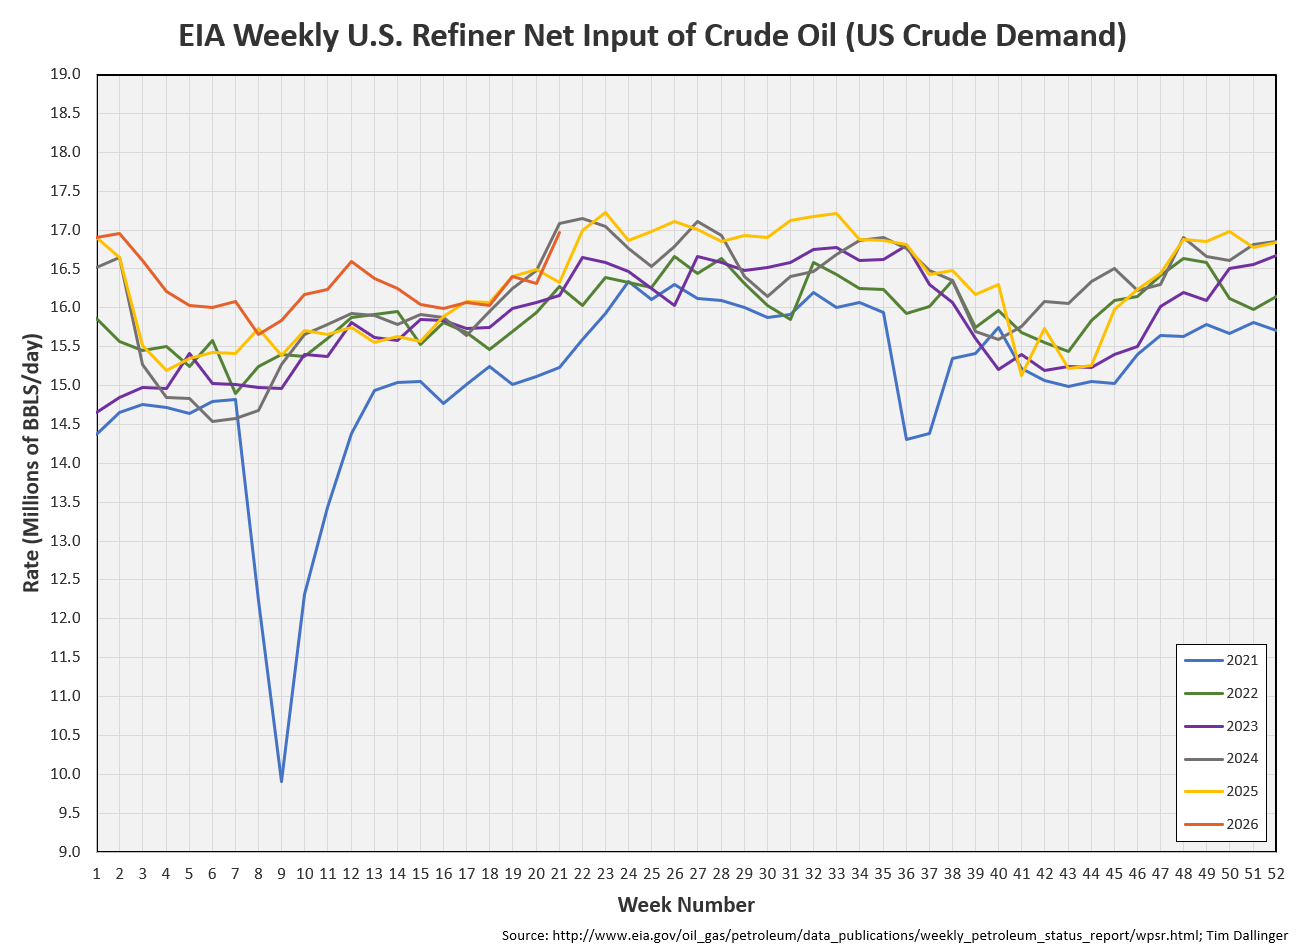
Critics question, with 440 MMB of crude inventory and 17 MMBD of peak refining utilization, doesn’t the US have almost of month of supply in storage? While this is valid question, it isn’t the “gotcha” that analysts claim. Let’s explore why.
Crude Inventories
Included in the footnotes of the EIA weekly report is the following description of crude inventories:
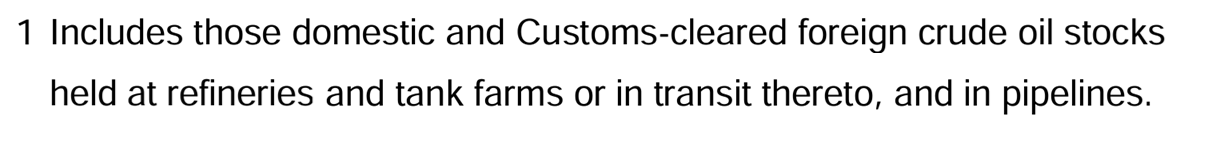
Not all of the counted inventory is “available.”
Linefill
Pipeline linefill is included in the inventory figure although it is not “available inventory.” See this article published last year on US Pipeline Linefill for further details.
Tank Bottoms
The EIA describes tank bottoms, “tank bottoms are volumes below the normal suction lines of a storage tank that may include water and sediment and are difficult to access.”
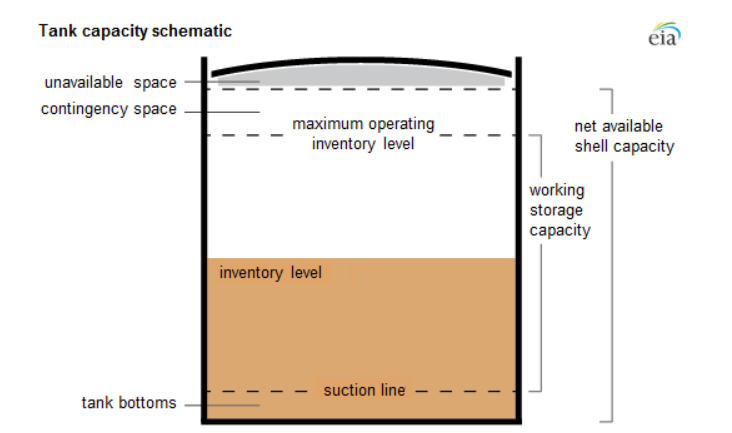
Source: U.S. Energy Information Administration, adapted from Monthly Bulk Terminal and Blender Report Instructions
This volume is difficult to access but even if it wasn’t, it isn’t desired. This volume that accumulates as the bottom of tanks is called sludge. It’s a multiphase water/oil/ solid composite, composed primarily of heavy hydrocarbon deposits, paraffin and asphaltene.
Every refinery has tanks. Every midstream tank farm is composed of tanks. This is an overhead view of Cushing. Cushing is the largest US tank farm but it isn’t the only one. When one considers that every tank has some inaccessible volume, the aggregate is no longer insignificant.
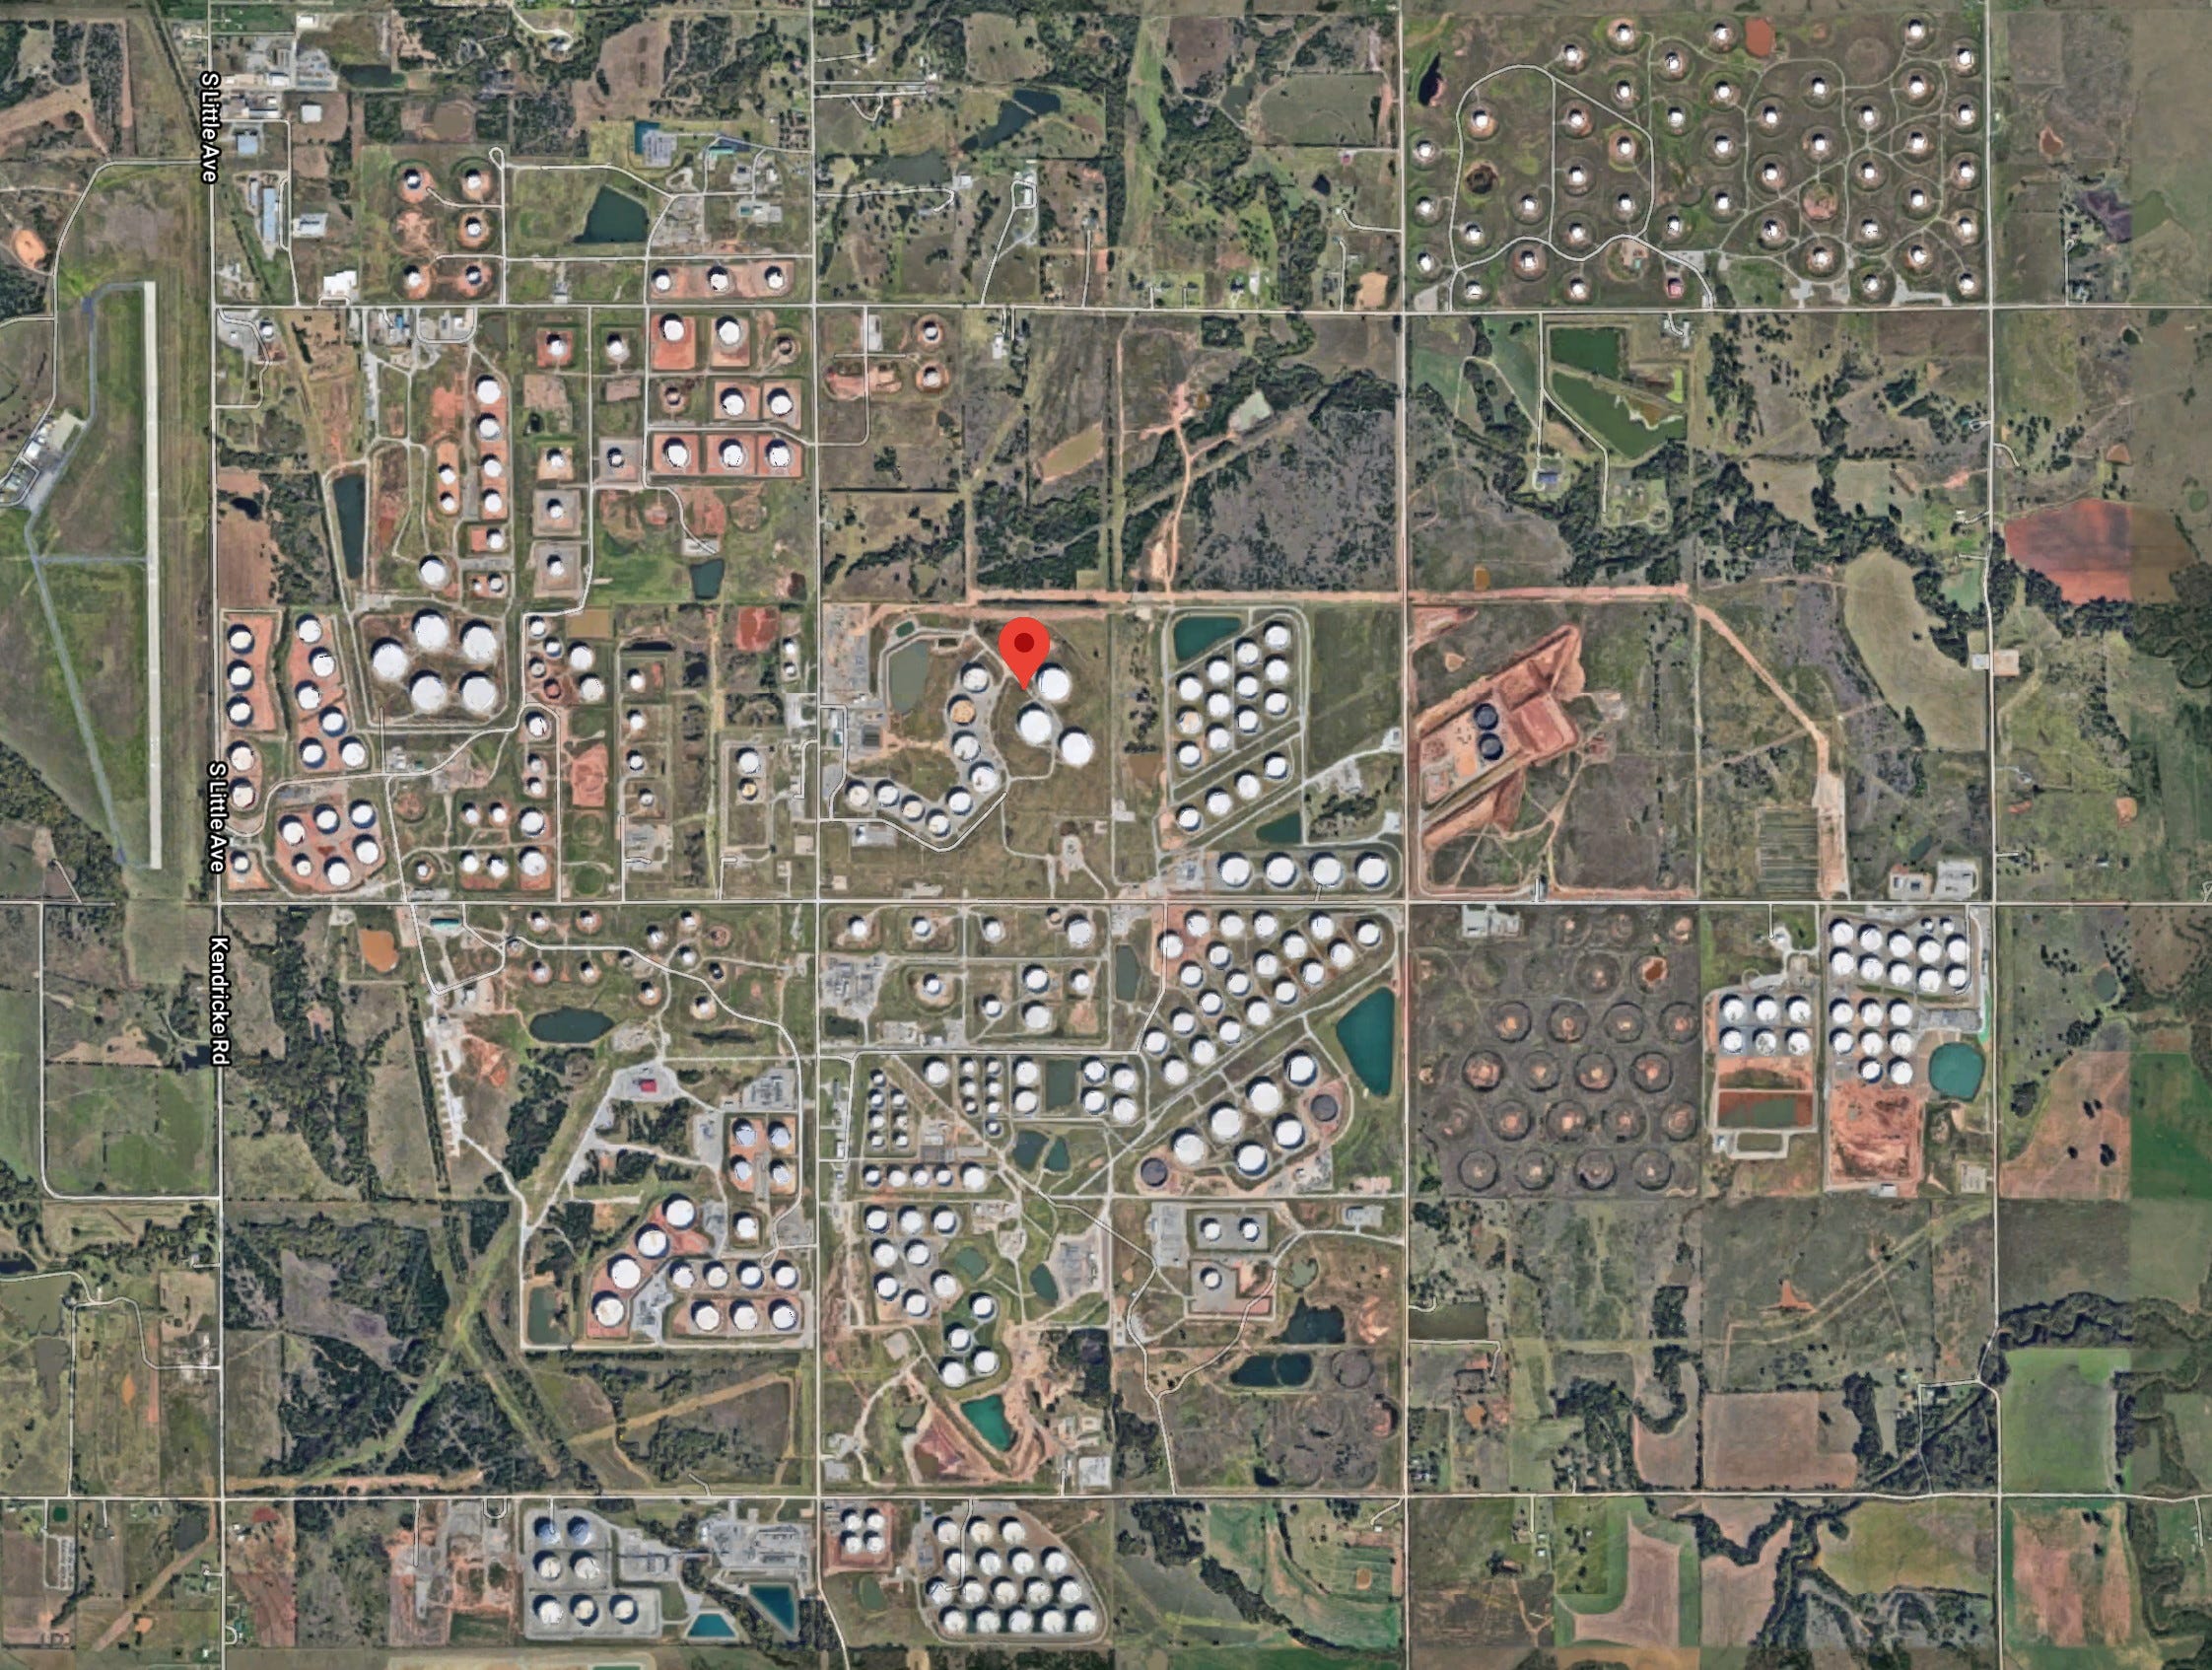
Source: TopZone
Available Crude
How much of the current 441 MMB is unavailable due to the inclusion of linefill and tank bottoms? That isn’t known.
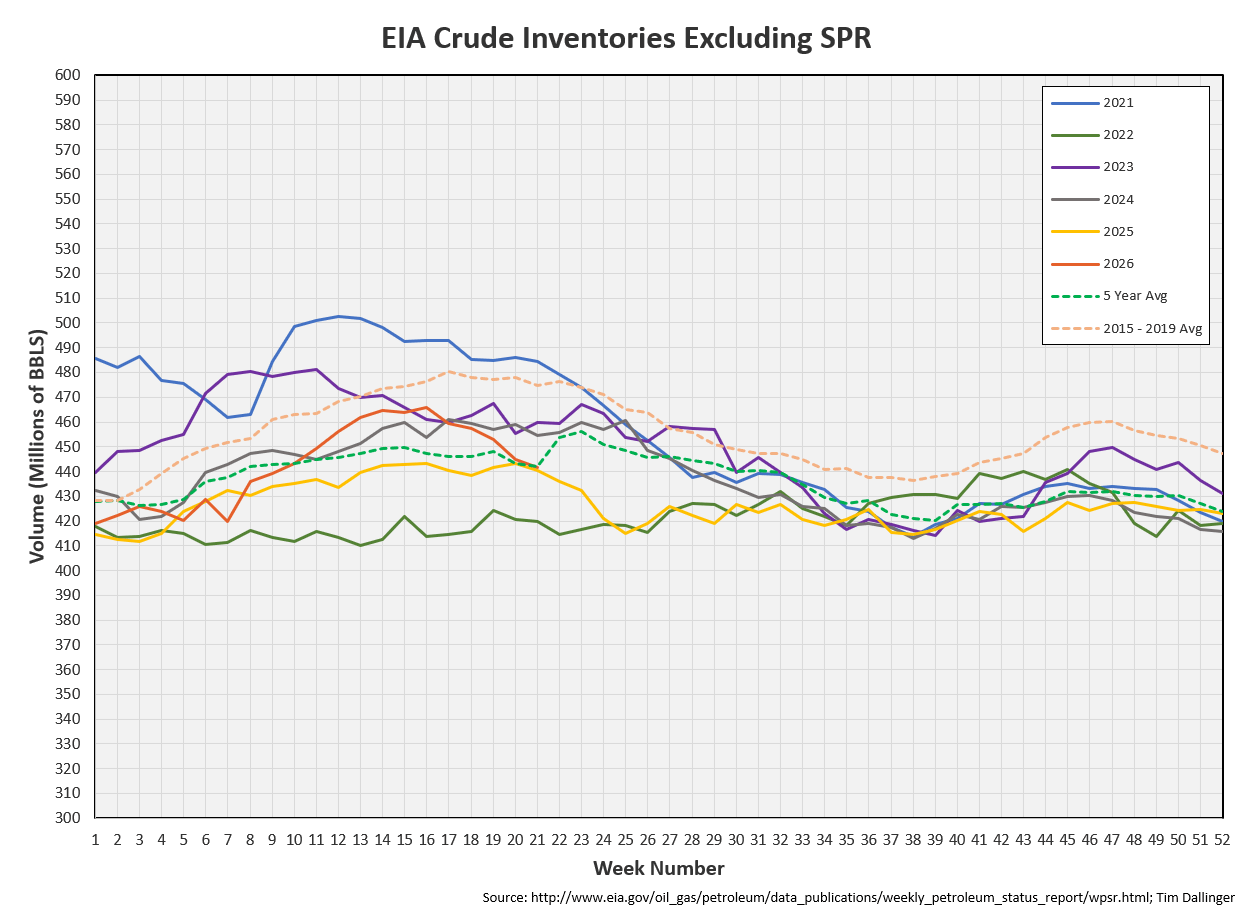
The lowest US crude inventories in recent times occurred in 2018 when crude hit 394 MMB. To witness lower inventories, data must go back to 2014. Although, care should be taken when considering the 2014 data set. There were fewer tanks and fewer operating pipelines 12 year ago.
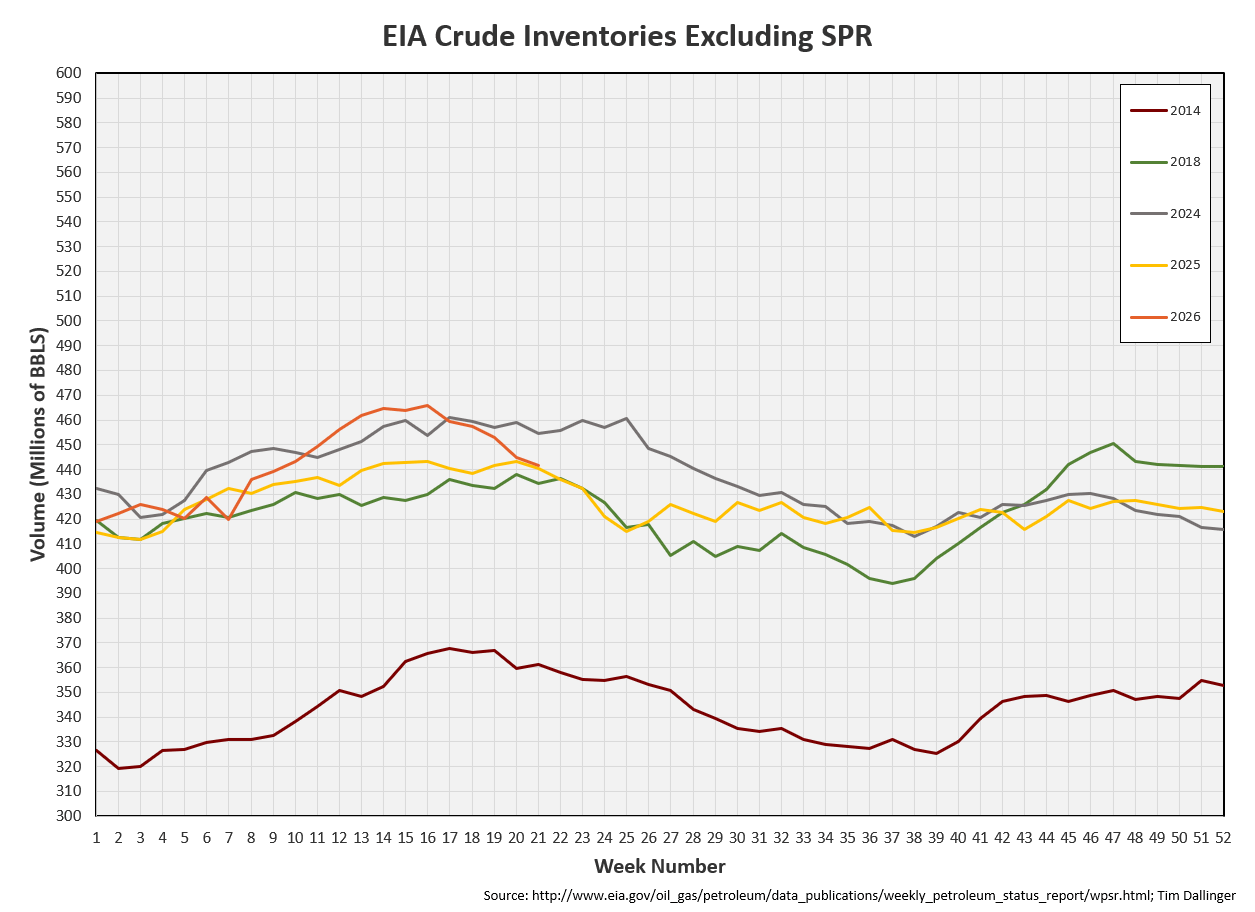
Projection
Even with record SPR release, US crude inventories are drawing at the fastest rate on record. At this draw pace, we’re weeks away from being near 425 MMB. If the draw continues from there, the US starts to test tank bottoms.
For those who intimately understand US energy market dynamics, the alarm is warranted. For those who don’t, continue to mock those who have studied these markets for decades. Let’s touch base again in a month.
Not investment advice. Informational purposes only. No specific positioning or security recommendations are intended. Sources are cited when available but accuracy of 3rd party data cannot be guaranteed.
“Bottom” was released by rock group, Tool, on their 1993 EP, Undertow.
This weekend I was reading the 1998 DOE paper on inventory dynamics and the 2004 NPC supplement + your linefill piece from last year. One of the counterintuitive things that really stood out was that if a pipeline is built the overall crude inventory increases, on paper, but its not drawable inventory so relative amount of drawable inventory actually decreases! Tricky
It's too bad the EIA doesn't publish the Working and Net Available Shell Storage Capacity report anymore :(
Great work and insight. This lines up with why Rory Johnston estimates tank bottoms to be around 400M